
Contributed By Gregory W. Ratcliff, Director, Advanced Analytics, Vertiv Corporation, and Brandon Schuler, Vertiv’s Electrical Reliability Services
May 10, 2019 | Batteries have been tested for performance for many years. The need for rigorous performance testing accelerated most rapidly in recent years due to technological innovation of mechanical, electrical, and chemical improvements. Battery users are challenged today, as they have been for many years, to measure and understand battery health and performance.1 The application of artificial intelligence enabled by a large volume of historical operating data directly addresses this challenge.
The Relationship Between Battery Usage and Measuring Techniques
Many applications enable routine tracking of battery system performance or provide the ability to exercise batteries periodically. Motive systems permit extensive, use-based feedback on battery performance through their regular use and onboard battery management systems. 2 Literature and research exist for stationary systems powered by wind3 and solar4 for various operators, who likewise can regularly choose to exercise their battery systems to measure and track performance degradations. Frequency regulation by independent service operators are likewise cycled regularly, including stochastic usage models to plan cycles and manage battery discharge depth, while measuring delivered and returned energy efficiency. 5
Conversely, standby stationary batteries are not actively utilized and rarely cycled. Standby systems, if not tested for capacity regularly, require different techniques to estimate their degradation and performance. Unique in this practical work is an example that demonstrates that statistical analysis and machine learning tools can lead to accurately forecasting potential failures in similar type batteries.
Predictive Methodology
The goal of the pilot project was to prove that artificial intelligence has the potential to accurately predict battery failure. In order to achieve this goal, a data analytics and battery specialist team was assigned to review historical data from a broad portfolio of batteries to identify at-risk batteries and then compare their findings with field tests of select batteries. The portfolio used for statistical, machine learning, experiential guidance and systems discussed, consisted of 100% VRLA type batteries, with a total installed base of 1,714,760 batteries.
The analytics team identified and examined VRLA batteries in a series configuration of 40 batteries per battery string for uninterruptible power supply service in two unmanned facilities. One facility was located on the west coast of the United States; the second facility was in the southeastern United States. A similar, although not identical, battery model and manufacturer throughout the installed base portfolio was chosen due to their similar capacity and construction with the model batteries at the identified test sites. Widely varying dates of initial service in the installed base spanned 15 years of data collection. This includes many repeated replacements at each site.
Within the data portfolio, two battery strings were identified as highest risk. The team then deployed a skilled, field engineering group to remove the battery strings from service and perform a discharge test to compare and validate the machine learning predictions against outcomes.
Maintaining and Measuring Standby UPS VRLA Systems
Performing periodic maintenance on standby VRLA battery systems at unmanned sites represents several challenges. 8, 9 Being able to utilize artificial intelligence to predict battery failure would provide a critical time and cost saving solution to these problems.
Practical Challenges
Battery testing at a non-staffed site is disruptive to edge and fog data centers. During our testing for this project, teams from three groups were rescheduled six times over the course of eight weeks to accommodate power failures, weather, and access issues.
Economic Challenges
The economic challenges of traveling to edge and fog sites are exemplified by their smaller size, limited parking for service support and geographically distributed locations that are required to be near the customers they serve. 10
Logistic Challenges
Unlike utility and telecom sites, which largely are managed by dedicated staff, edge sites require an increased level of coordination between operator, owner, lessee and multiple service providers. There is often resistance to battery preventive maintenance due to the perception that a battery system is healthy if it is not in an alarm state, even though practitioners recognize a battery system’s state of health is continuously degrading. 11
Using Artificial Intelligence to Predict Service Life
A common practical and experiential method for battery service life forecasting and prediction that is employed by many operators is based solely upon time in service. 12. 13
While date codes and time in service are often used to estimate a general service life for VRLA batteries, there is significant interest in artificial intelligence providing a more accurate measure of battery health with the ability to extend the available service life and eliminate the waste of removing well performing batteries based on age.
In machine learning and artificial intelligence systems, a feature is “an individual measurable property or characteristic of a phenomenon being observed. Choosing informative, discriminating and independent features is a crucial step for effective algorithms in pattern recognition, classification and regression.”14
Specific to batteries, each of the features of construction, fabrication, and specific gravity are unique to each manufacturer and model; therefore, each battery’s model number was considered independently. The handling, installation, and position of each battery is also unique and considered independently.
Temperature Measurement
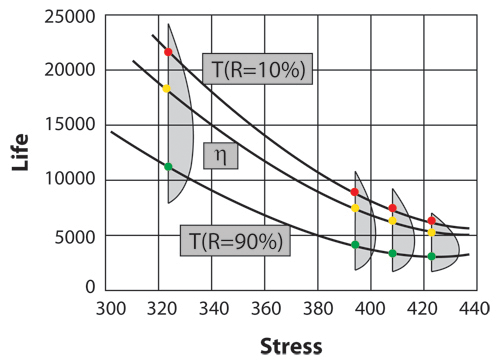
One method to estimate and arrive at an improved service life is utilizing the temperature feature and applying the Arrhenius life acceleration stress model (see figure 1). This technique is used to calculate the integral of temperature exposure of each battery over time from storage and through operation.15, 16, 17 In a previous study, across a large population of batteries, it was confirmed that temperature was a leading service life prediction feature.18
Voltage Measurement
Voltage, or more precisely optimal float voltage based upon temperature, is a key feature measured for VRLA service life prediction. As noted previously, in standby applications each battery operates continuously for its service life at the float voltage the operator has set. Float voltage has also been shown to be a key service life determinant.6
Taken in their entirety the features above have been shown to predict service life of a UPS battery with 92% accuracy.19
Age and Ohmic Measures
Uncontrollable features and those that can be easily measured repeatedly include age and ohmic resistance. Ohmic resistance was found to be a battery-specific unique feature.
Therefore, the analysis team started with an initial ohmic resistance reading established in the first 10% of the battery’s lifecycle, which was then used as the baseline for comparative analysis during each subsequent preventive maintenance event. This technique has been utilized rigorously and continuously for more than 10 years for the entire portfolio in this research.
Stressors
For stationary battery service, the analysis team determined temperature and float voltage to be key features, which we coined “stressors,” on the health of individual batteries. The best possible service life is obtained by minimizing stressors for each battery in AC UPS service.
Reporting Methodology
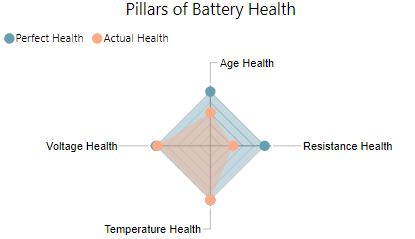
Utilizing key features and stressors, a reporting method was developed to simultaneously display the state of health and risk in a method that can be portrayed in aggregate or by battery and still carry the same meaning and interpretation when viewed. The technique involved simultaneously portraying four key dimensions which showed both controllable and non-controllable features and stressors (see figure 2).
Each of the four axes represent a zero stress, ideal status for the battery’s real age, overlaid with the actual health of the battery. The area within the actual health axis represents a health score, while the outside area represents risk. A battery at high risk of failure would show as a small square within the larger square. Each area of actual health can then be summed, analyzed and contrasted against other batteries of similar age, charge voltage, temperature exposure and ohmic resistance values.
Figure 2 also depicts quickly for the operator those controllable elements that, should they choose to intervene, will extend the service life of a battery portfolio, string or single jar.
A Practical Test of Predictive Analytics
The system of practical experience, statistics, and lessons from machine learning was put to the test in 2018.
The analytics and battery specialist team documented a practical demonstration of rigorous preventive maintenance, careful ohmic measurement, data science and analysis for a large customer with 350 strings of VRLA batteries. The team identified, from the data, a string or strings that were currently at risk. The framework of the group’s assignment was to examine data from all 350 strings of VRLA batteries and to rank the strings from highest to lowest risk utilizing the battery health and risk areas described previously. Once at-risk systems were identified, the team then traveled to the two sites and performed tests similar to the IEEE Std. 1188 capacity test.
Selection Criteria
Based upon machine learning techniques described previously18,19, two strings at each of the two sites that otherwise appeared healthy but were ranked with the highest risk of failure in the 350-string portfolio were identified as candidates for full discharge testing and measurement based upon the area of the battery health shown in figure 2.
Planning for Battery Testing
The finalized plan closely followed IEEE Std. 1188 with exceptions taken for discontinuance of testing. Given the time and expense to conduct the tests, the team chose to measure the total capacity to a voltage drop off, not seeking the 80% capacity threshold of the recommended practice IEEE Std 1188 8.
Testing Criteria
Four strings were tested. After consultation with site engineers, testing engineers and the customer, a test load of 300 Amperes was chosen to best represent a real world, practical discharge of the system, well below the maximum design capacity, with an expected runtime of 20 minutes.
Note: In a constant power environment, AC UPS systems typically increase the current on the DC system from the coup de fouet and subsequent voltage drop as the battery discharges. For the testing described, the discharge current was held constant between 303.1 and 288.0 Amperes across all strings for all tests, until voltage drops prevented current maintenance and the test ceased operations.
In concert with IEEE recommendation 118817, there were no discharges within the preceding 30 days and systems were equalized within 30 days and before 3 days of the test. The modified criteria is similar to an IEEE Std. 1188 7.6 Service test.
(See sidebar at end for capacity testing procedures for validating battery failure predictions)
Results
Graphical depictions of discharge graphs are shown in figures 3 through 6. String A represents the poorest performing string with a termination of discharge ending in less than three minutes. String A is characterized by several batteries falling below 1.5 volts per cell within 60 seconds.
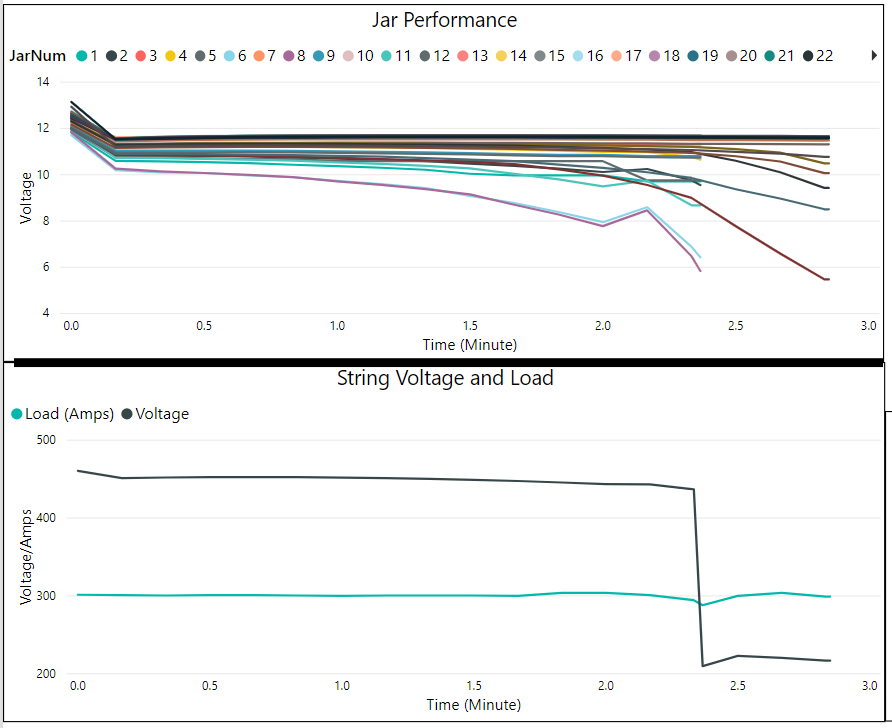
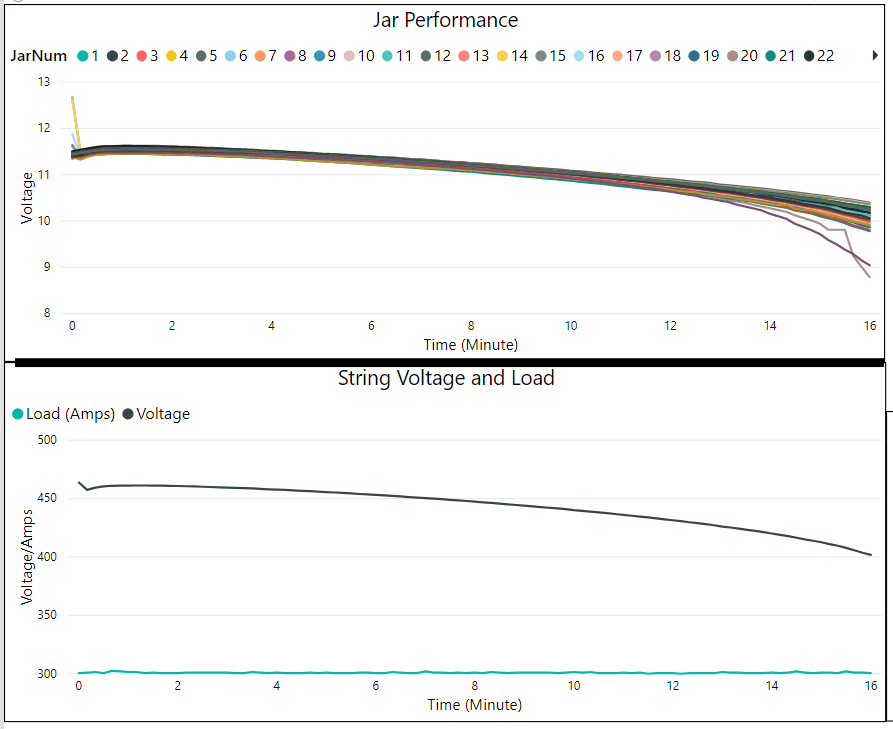
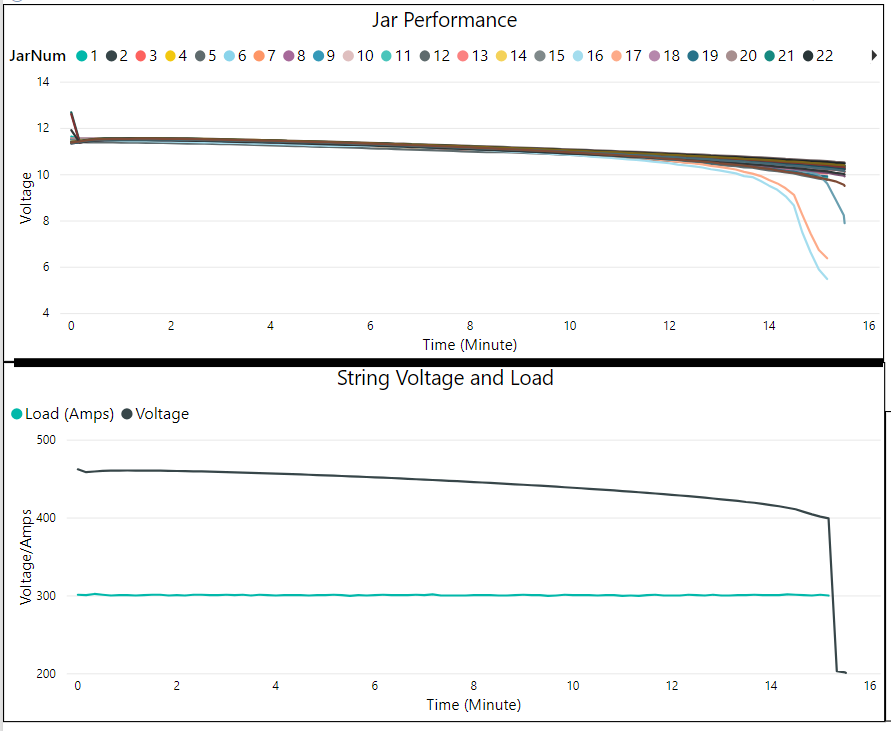
String B (Figure 4) performed much better than string A, but showed two battery falling to 1.5 volts per cell within 12 minutes.
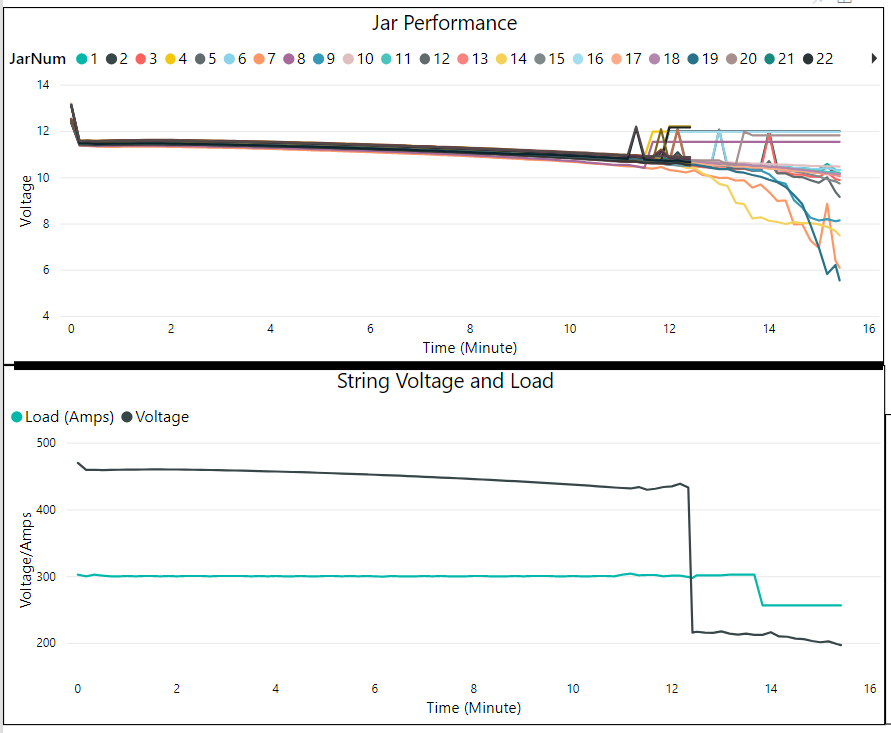
Strings C (Figure 5) and D (Figure 6) were not shown to be at high risk and provided greater than 400 Volts DC for 15 minutes.
At the conclusion of testing, the team and customer jointly conferred and chose to replace string A and B in their entirety and replace two battery each in strings C and D. Upon replacement of the batteries, the battery strings were charged to 100% and returned to service in accordance with customer policies and Vertiv standards.
Conclusion
Rigorous and repeatable ohmic resistance readings, which were continuously compared to an initial baseline by battery, with temperature measurement, voltage measurement and a large portfolio of “normally” operating batteries permitted the creation of a system that provided both visualization and risk ranking for VRLA batteries in AC UPS service. The visualization and ranking system permitted the “uncloaking” of hidden vulnerability and high-risk battery strings that would not have been recognized otherwise. Further study is required to determine if these results are repeatable across a wider demographic of applications, models and feature variations.
SIDEBAR
Validating Battery Failure Predictions from Data Analysis
Based upon machine learning techniques cited in the article, two strings at two sites that otherwise appeared healthy but were ranked with the highest risk of failure, were selected for verification.
Capacity testing, as specified in IEEE 1188, was performed. A test load of 300 Amperes was chosen to best represent a real world, practical discharge of the system, well below the maximum design capacity, with an expected runtime of 20 minutes. The battery testing took voltage measurements utilizing a BCT (battery cell tester), and Albér 2N resistive DC load bank. Since this equipment can only test up to 270 VDC the test cycles were broken in half.
Note: In a constant power environment, AC UPS systems typically increase the current on the DC system from the coup de fouet and subsequent voltage drop as the battery discharges. For the testing described, the discharge current was held constant between 303.1 and 288.0 Amperes across all strings for all tests, until voltage drops prevented current maintenance and the test ceased operations.
In concert with IEEE recommendation 118817, there were no discharges within the preceding 30 days and systems were equalized within 30 days and before 3 days of the test. The modified criteria are similar to an IEEE Std. 1188 7.6 Service test.
Capacity Testing Procedures
- Measured and recorded the electrolyte temperature
- Measured and recorded float voltage
- Isolated the customer battery from the system
- Initiated the capacity test.
- At conclusion of test, recorded the elapsed test time
- Monitored the initial recharge and, if necessary, adjusted the rectifier output current limit and output voltage levels
The capacity-test raw data was recorded for each jar in Albér formatted BTR files. The onsite field test results were compared against the failure predictions produced by the artificial intelligence methodology. In each case, the jars that presented a state of high resistance in the data analytics, in fact, aligned with the field test results. While on site, the battery specialists replaced two strings and replaced two jars in each in the other two strings extending their battery life.
This methodology suggests that by performing quarterly battery analysis, customers can not only monitor the health of their system and reduce risk of failure, but also utilize the information to inform the maintenance priorities, optimize replacement cycles and budgets.
Authors:
Brandon Schuler joined Vertiv’s Electrical Reliability Services team in 2014 and has 20 years of experience in performing and managing electrical/electronics testing and maintenance. Brandon served for eight years in the in the United States Air Force, trained in Advance Electronics and Electrical Principles, earned several factory-level certifications, and supported several units as a military technician at multiple duty stations. Additionally, he earned an Associate’s Degree in Electronics Engineering Technology, from Community College, Airforce. As an expert electrical technician and an experienced team leader, Brandon helps customers get the most out of the electrical assets that support their critical processes and systems.
In his current role, Gregory Ratcliff leads the Vertiv global advanced analytics group focusing on Internet of Things (IoT), predictive maintenance, and product health indices to Vertiv’s telecom, data center and utility customers. Prior to joining Vertiv Services and Software Solutions, Greg led the monitoring product management and marketing efforts at Liebert North America. He has several patents in remote control and power management, has published several articles and white papers which share the value of tying together IoT, Machine Learning, Artificial Intelligence and secure systems. Ratcliff has undergraduate degrees in applied mathematics, information systems, and has a master’s degree in business administration.
References:
- Blume, P., “Energy Storage System Performance Testing,” In Battcon Stationary Battery Conference (pp. 1–6), 2015.
- Wood, E., Alexander, M., & Bradley, T. H., “Investigation of battery end-of-life conditions for plug-in hybrid electric vehicles,” Journal of Power Sources, 196(11), 5147–5154. https://doi.org/https://doi.org/10.1016/j.jpowsour.2011.02.025, 2011.
- Shezan, S. K. A., Julai, S., Kibria, M. A., Ullah, K. R., Saidur, R., Chong, W. T., & Akikur, R. K., “Performance analysis of an off-grid wind-PV (photovoltaic)-diesel-battery hybrid energy system feasible for remote areas,” Journal of Cleaner Production, 125, 121–132.
- Li, J., & Danzer, M. A., “Optimal charge control strategies for stationary photovoltaic battery systems,” Journal of Power Sources, Elsevier B.V. https://doi.org/10.1016/j.jpowsour.2014.02.066, 2014.
- Kumar, R., Wenzel, M. J., Ellis, M. J., ElBsat, M. N., Drees, K. H., & Zavala, V. M., “A Stochastic Model Predictive Control Framework for Stationary Battery Systems,” IEEE Transactions on Power Systems. IEEE. https://doi.org/10.1109/TPWRS.2017.2789118, 2018.
- Butler, P., Dunleavey, J., Farber-DeAnda, M., & Moseley, P., “Performance of valve-regulated lead-acid batteries in real-world stationary applications — utility installations,” Journal of Power Sources, 96(1), 94–101. https://doi.org/https://doi.org/10.1016/S0378-7753(01)00713-3, 2001.
- Smith, P., “Trends in Telecom Power: Efficiency gains when battery and power technologies intersect Telecom Technology,” In Battcon Stationary Battery Conference (pp. 1–7), 2015
- Chhajer, D., & Foster, R., “Battery Discharge Testing : Implementing NERC Standards and Field Experiences,” In Battcon Stationary Battery Conference (pp. 1–13), 2014.
- “IEEE Recommended Practice for Maintenance, Testing, and Replacement of Valve-Regulated Lead-Acid (VRLA) Batteries for Stationary Applications – Amendment 1: Updated VRLA Maintenance Considerations,” IEEE Std 1188a-2014 (Amendment to IEEE Std 1188-2005). https://doi.org/10.1109/IEEESTD.2014.6853300, 2014.
- Bilal, K., Khalid, O., Erbad, A., & Khan, S. U., “Potentials, trends, and prospects in edge technologies: Fog, cloudlet, mobile edge, and micro data centers,” Computer Networks, 130, 94–120. https://doi.org/https://doi.org/10.1016/j.comnet.2017.10.002, 2018.
- Pedersen, G., “Battery Management Isn ’t Black and White One Year in a Battery ’s Life,” In Battcon Stationary Battery Conference (pp. 1–9), 2015.
- Byrne, J. A., “The Proper Storage of Stationary Batteries Terminology , Limitations and Applicability Why is proper storage important ? Receiving the Battery Unpacking,” In Battcon Stationary Battery Conference (pp. 1–8). Orlando, Florida, 2017.
- Demar, P., “What would you do if you found pallets of VRLA batteries in your warehouse that had manufacturing dates of 3 . 5 years ago , and never been charged?” In Battcon Stationary Battery Conference (pp. 1–7), 2014.
- Feature in data science. (n.d.).
- Boden, D. P., “A New Method for Maintaining the Charge of VRLA Batteries in Standby Power Systems,” In Battcon Stationary Battery Conference (pp. 2–8), 2014.
- Lele, S., Ashish, A., & Kip, B., “Predicting the Life of Li-Ion Batteries Using the Arrhenius Model,” In Battcon Stationary Battery Conference (pp. 1–6). Nashville, Tennessee, 2018.
- Searles, C., & Schiemann, M., “Understanding and Differentiating Design Life, Service Life, Warranty and Accelerated Life Testing for Lead Acid Batteries Abstract Introduction What is Design Life?” In Battcon Stationary Battery Conference (pp. 1–9), 2014.
- Ratcliff, G. W., “Battery Full Life Analysis with Portable Instruments and Computers,” In Battcon Stationary Battery Conference (pp. 1–10), 2014.
- Ratcliff, G. W., “Data Analysis to Optimize UPS Battery Performance and Management Service Description,” In Battcon Stationary Battery Conference (pp. 1–15). Boca Raton, Florida, 2016.
- Tressler, R., “Performance Testing Lead-Acid Stationary Batteries: Myths, Misunderstandings and Mistakes Myth # 1 – Performance Testing Ruins the Battery Myth # 2 – Always Equalize Vented Batteries Before a Test Equalize Charge in the Context of Acceptance Tests,” In Battcon Stationary Battery Conference (pp. 1–6), 2016